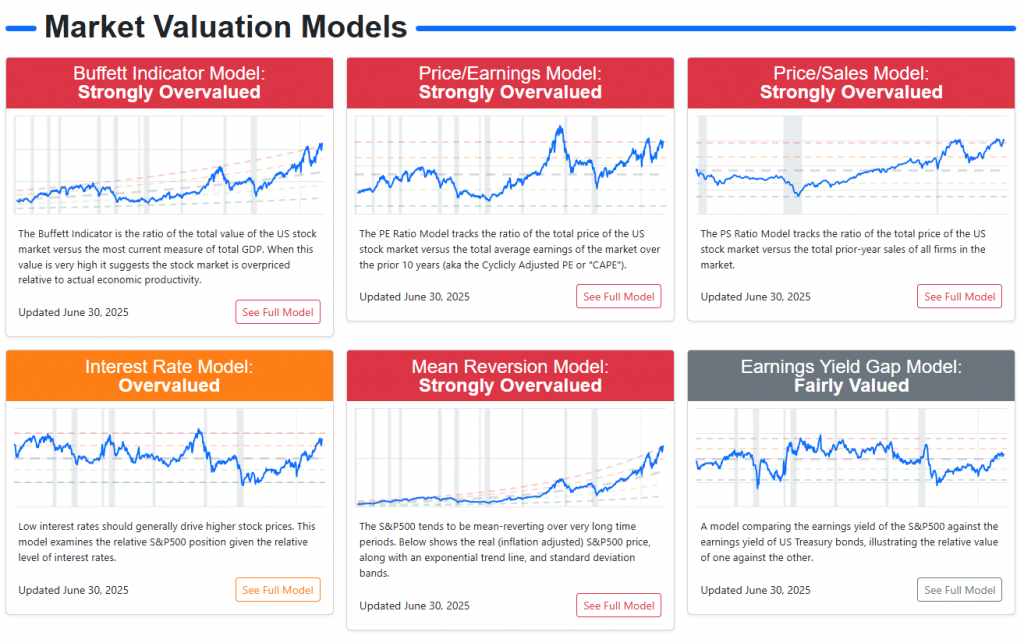
With the current leverage levelsa few valuations driven more by euphoria than by fundamentals and a artificially compressed volatilityThe market was in an increasingly unstable equilibrium.
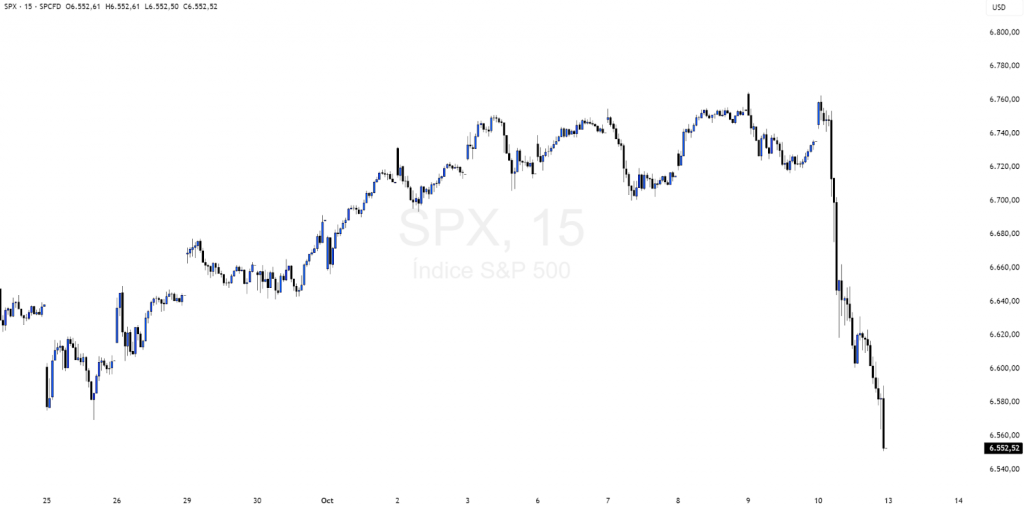
All it took was a new trade threat between United States and Chinaa post by the President of the United States of America, Donald Trumpannouncing a "massive tariff increase"specifically an increase of 100% over existing rates, effective November 1, 2025The price of the stock, caused an immediate drop in the main indexes.
Minutes later, upon official confirmation of the measuresales accelerated sharply, leading the main indexes to record their strongest worst day since April.
Then, in a new comment from Trump, noting that he had not canceled the meeting with Xi Jinping, partially moderated the slumpallowing a technical rebound during the post-market.
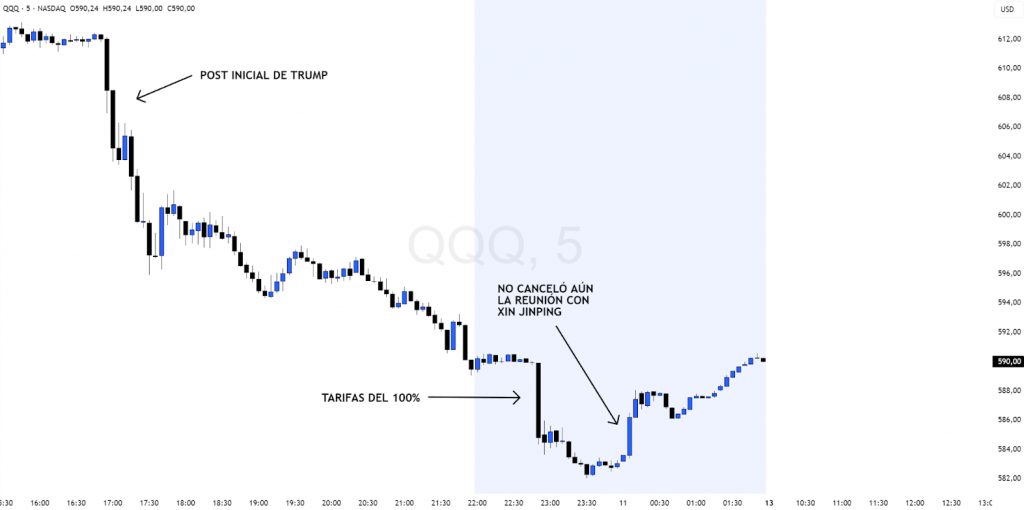
The result was simple but drastic, a largest equity sell-off since april and a sharp spike in volatility.
Friday left the following widespread falls on Wall Street:
S&P 500 -2,71% | Nasdaq -3,56% | Dow Jones -1,90% | Russell 2000 -3,01% | VIX +31,83%
In the futures market, losses were even greater:
US 500 -3,33% | US Tech 100 -4,33% | US 30 -2,38% | US 2000 -4,04% | VIX +24,57%
Behind this pullback lies a structure of extreme leverage and mechanical flows of forced sales.which could reach $150 billion if market declines extend to -3%.
Putting in context, one of the main sources used for this analysis comes from Nomura Securities International. (based in New York), through its chief strategist of Cross-Asset Strategy, Charlie McElligott.
McElligott is one of the most widely followed voices of institutional managersrecognized for its ability to anticipate movements arising from mechanical flows, systemic leverage and volatility dynamics in the markets.
Their perspective, supported by institutional positioning information and market structure models, has allowed us to contextualize and reinforce this analysis.
The calm before the storm
Over the past few months, realized volatility has fallen to historically low levels around 6% on the S&P500, primarily driven by a combination of structural factors:
Institutional investors selling volatility through structured products and exotic notes to generate additional returns:
Many institutional funds have been selling volatility through structured products and complex derivatives. In practice, this means that they make money as long as the market remains stable, but take losses if there is a shock. It is a profitable strategy, until it is no longer profitable. The more they participate, the more they put downward pressure on implied volatility, creating an artificial calm.
Decorrelation between individual stocks, which smoothes the behavior of the indexes:
While some stocks, such as those linked to artificial intelligence, are rising strongly, other sectors are moving in the opposite direction. This lack of synchrony makes the overall index (such as the S&P 500) appear stable, even though below the surface there is a lot of turmoil. It's like a calm sea on the surface, but with strong currents underwater.
Perception that the rate cycle and tariff risks had peaked:
After months of interest rate hikes and tensions with China, many investors think that the worst is behind them. That sense of "the storm is over" has reduced fear and, with it, the need to protect themselves with options or hedges. When fear goes down, so does volatility.
Expansionary fiscal policies tolerated by increasingly accommodative central banks:
Expansionary fiscal policies, being more public spending and stimulus, are being maintained by increasingly lax central banks. The message perceived by the market is clear: "if something goes wrong, someone will act". This confidence in institutional support reduces the risk premium and keeps volatility at bay.
Euphoria over artificial intelligence, which has driven earnings, buybacks and valuations:
AI has become the big market driver. Expectations of growth and productivity have driven profits and risk appetite. Each rise attracts more money, and that money triggers further rises: A virtuous circle that keeps the market on fire and volatility under some control.
Record buybacks by the major technology companies, which have maintained share prices and reduced implied volatility:
The big technology companies, the well-known Magnificent 7are using their enormous cash flow to repurchase its own shares. These buybacks act as a "cushion" that supports prices and reduces sharp movements. The more they buy, the more stable the market becomes, and the more volatility sinks.
The silence before the noise; the false calm of the market:
All of these factors have created an environment in which tranquility is the result of financial engineering, not the absence of real risk. As an old market rule goes: Prolonged stability is often the prelude to instability.
Even so, this calmness does not mean absence of risk, but rather a forced volatility compression. The market has become so accustomed to rising smoothly that every small upward move attracts even more money, from leveraged funds to retail investors who don't want to be left out.
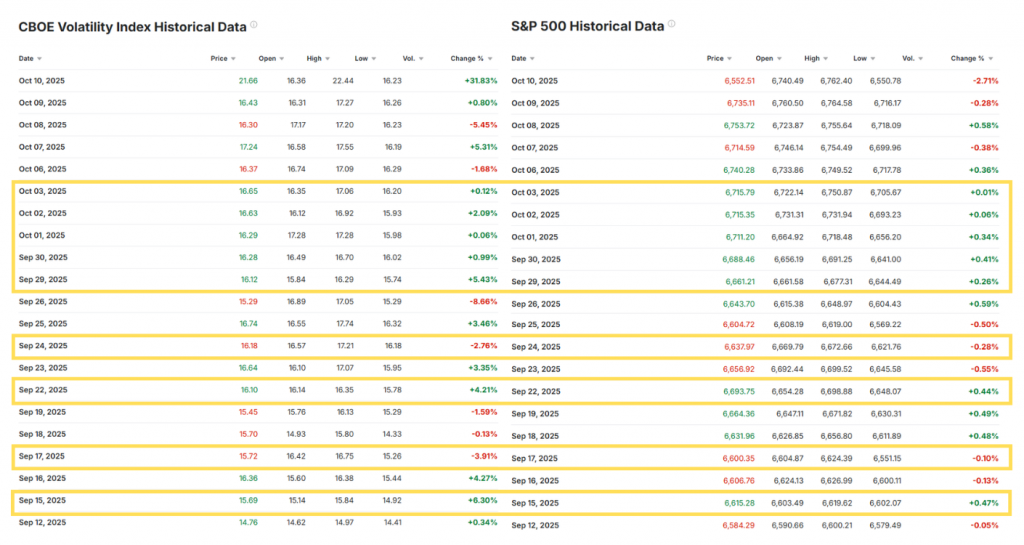
This combination of euphoria, leverage and overconfidence has given rise to an unusual phenomenon: Volatility no longer goes down when the market goes up, but rather starts to climb up next to him. If you have been paying attention to the market during these last days/weeks and even months, you may have seen how the S&P 500 and VIX rise in tandem on several occasionssince the creation of the VIX in 1990, never happened this often before.
This behavior, known as "Spot Up, Vol Up"is a sign that complacency is reaching extreme levels and that the market may be entering a phase of Widespread institutional FOMO.
"Spot Up, Vol Up": The new FOMO
Unlike what usually happens, and I'm talking about when volatility tends to go down as prices go up, in the last few weeks the market has shown this uncommon behavior known as "Spot Up, Vol Up": The indexes rise and, at the same time, implied volatility also increases.
This phenomenon, which historically only appears in around 12% of annual sessionsreflects a level of FOMO (fear of being left out) extreme and a a huge appetite for call optionsespecially in sectors linked to the technology and artificial intelligence. In other words, investors are so convinced that the market will continue to rise that they buy protection and bullish exposure at the same time, which increases the demand for volatility rather than reducing it.
This, together with the rise of the Leveraged ETFs amplified this effect. These funds, mostly concentrated in technology companies, which already account for close to 83% of total exposure including those linked to the S&P 500, they function as automatic accelerators on the marketthat is, every time prices rise, they must buy even more shares to keep their leverage constant.
According to estimates, the process of daily end-of-day rebalancing during the last month, it would have generated a additional demand in excess of 1TP4Q43 billion.
A figure that stands at highest percentile of the whole historical series.
In practice, this means that a significant portion of the recent gains have not come from "natural" purchasesbut of automatic and leveraged flows that push prices higher and higher, thus feeding the market's sense of artificial strength.
Mechanical flows and forced sales
Yet, this same structure that drives the market higher becomes a trap when the correction comes.
The models of volatility control and the CTAs (Commodity Trading Advisors) automatically reduce exposure as soon as the price falls or volatility rises, activating forced sales without human intervention.
According to Nomura's previous estimates, the -3% decline triggered automatic sales of about 1TP4Q151 billionmainly since systematic funds and leveraged ETFs.
The operating table of UBS estimated a similar effect, a decrease of -1% would have triggered sales of between 1TP4Q20,000 and 1TP4Q25,000 milliona drop of -2% on $95 billion-105 billion and the correction of the -3% would release up to $280 billion in automatic vending flows.
The following graph, based on the Nomura's "Index Rebalance Projection".reflects this structural asymmetry, the money programmed for sell on the dips multiplies several times the amount available for buy on the upside.
In other words, the system is designed to accelerate declines y smoothing recoveriesgenerating a self-reinforcing risk dynamics.

This pressure is compounded by the behavior of the option dealersthat for months they kept long positions in gammaacting as market stabilizers.
However, after reducing more than $6 billion in long exposure to the S&P 500the third largest daily decline in historyaccording to the derivatives desk of Goldman Sachsthe dealers switched to negative gamma.
This caused each new downward leg would force them to sell more futures or shares to cover their exposure, amplifying the movements y increasing the speed of falls.
The result was a feedback loop that transformed a technical correction into a institutional cascading.
Vega's rebalancing: Gasoline for volatility
In addition to the forced sale flows, there is another factor that can aggravate the already existing movements, the rebalancing of Vegai.e., how the funds and dealers that operate with the VIX adjust their hedges when volatility changes.
While the VIX stays near 20 or 21 points, the market remains under control. But if fear increases and the VIX rises towards 25 or morethe VIX-linked ETNs and the option dealers should buy more volatility to keep your exposure balanced. This adjustment is not gradual; it happens all at once, and the higher the VIX rises, the more volatility they have to buy..

The chart above shows that relationship clearly, when the VIX goes from 25 a 35the combined demand of the ETNs and dealers jumps from just 30 million to more than 150 million Vegaa magnitude sufficient to to violently accelerate the spike in volatility.
In the marketplace, this means that if volatility starts to rise, the system itself fuels it even further. The coverage models become automatic volatility buyers at the very moment when the market fears it the most, generating a domino effect which amplifies declines in the indices and causes a simultaneous increase in the tail riskthe likelihood of extreme downward movements, and of the skewwhich represents the additional premium that investors are willing to pay for downside protection options.
That is to say, when the VIX crosses certain key levels, volatility ceases to be a consequence of fear and becomes its fuel..
Volatility structure tightens
The calm was sharply broken on Friday. The VIX (the market's main volatility index) exceeded the level of 22while the VVIXwhich measures the "volatility of volatility", climbed to 110reflecting a notable increase in the demand for protection.
The skew of the S&P 500 (in this case, referring to the price difference between put and call options) was strongly steepedinvestors lowered the strikes on their puts more aggressive hedging and took profits on their call spreads on the VIXThis is a sign that the pressure to hedge risk has shifted to the short term.
The result was a generalized spike in implied volatility across the entire maturity curvewith the contracts of October up +3.1 vols and November +1.7 vols..
According to Goldman Sachsthe one-month average implied volatility of the S&P 500 stocks is already in the 97th percentile from 2023a level that historically precedes episodes of market stress.
In parallel, the goldtraditional refuge in times of uncertainty, recorded its largest drop since June. After weeks of excessive optimism reflected in its call skew flattenedsome investors began to take benefits in bullish positions, suggesting a broader adjustment of risk appetite in defensive assets.
Why the market has not yet collapsed
The market has not yet fallen because there is still a small technical support area which acts as a cushion against selling pressure. But this balance is very fragile.
For years, investors have been accustomed to the same strategy, sell volatility and buy on the dips. Every time the VIX went up or the market corrected, the reaction was almost automatic, closing hedges and betting on the rebound.
This time it is different. The automatic sales flowsfrom systematic funds, CTAs and leveraged ETFs, are so large that are overriding the ability of the market to stabilize. Traditional hedges are no longer sufficient to halt the downturn.
In addition, investors are buying more puts and bearish protectionThis aggravates the situation. In this environment, the dealers (option market intermediaries) are in the short gamma positionwhich means that when the market falls, must sell even more futures or shares to hedgeamplifying the falls.

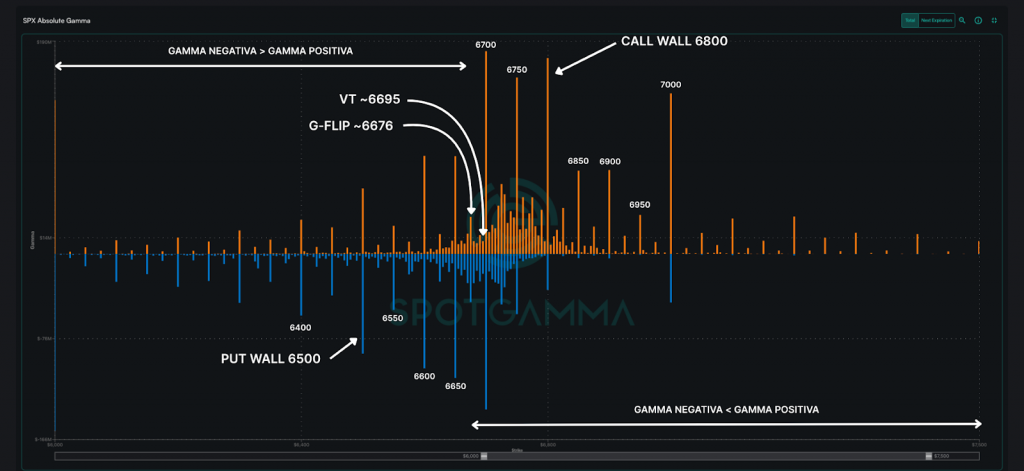
The graph above shows this with complete clarity, there is only one remaining small positive gamma zone among the 6,550 and 6,650 pointswhich is serving as temporary cushion. Outside that range, the exposure becomes negative, which causes every rebound is sold y each new fall gains its own strength.
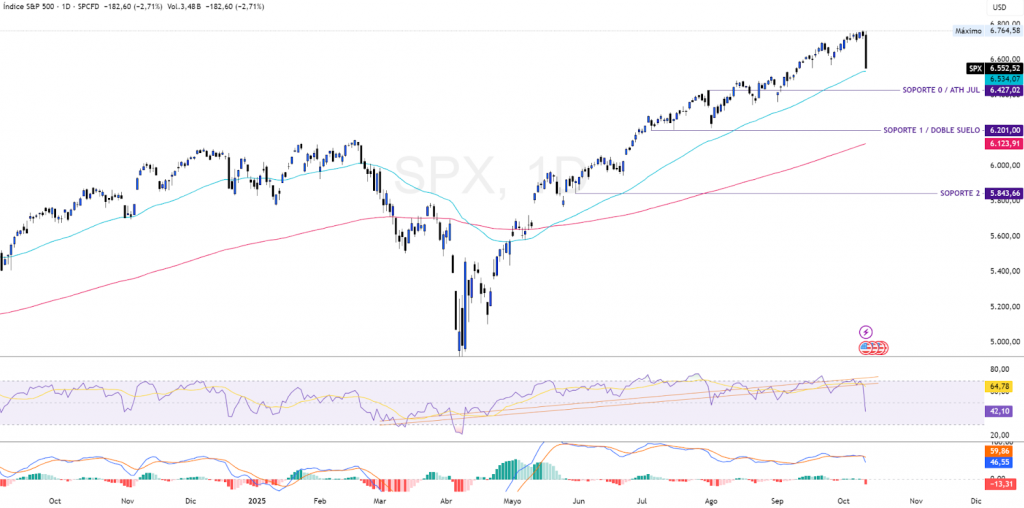
Therefore, the market still holdsbut it does artificiallysupported by the last traces of positive gamma. If this band is broken, the next relevant technical support is at the daily 200 EMA.a level that could act as an interim stabilization point before the market attempts to rebalance.
The perfect storm: Trump, AI and leverage
The spark that started it all was policya new post by Donald Trump announcing to the world and imposing China additional fees was enough to trigger panic.
With the current scenario playing out fuel: Record leverage, extreme complacency and a market hypersensitive to any shock.
The reaction was immediate. The SPX fell to 6552 pointsvery close to the put wall located in 6500level, which I have already analyzed and mentioned in the analysis of options on SPX on october 06th.
With the G-Flip located at ~6676 pointsthe index went to negative gammawhich intensified the fall and currently leaves open the possibility of additional falls over the next week.
The Call Wall remains at 6800 pointsalthough in order to retest it, the price will have to be return to positive gamma territory first.
As the price approached these critical areas, the traders started buying puts on a massive scaleby raising the tail risk (tail risk) y stressing the entire maturity curve.
The request for protection in both the short and medium term, reflecting an increase in the abrupt change in market sentimentFrom technological euphoria and institutional complacency to a generalized defensive mode.
To really understand what moves the market, it is not enough to look at prices: you have to follow the institutional positioning and option flows. The levels of gamma, put and call walls mark the areas where large traders react and where volatility can change suddenly.
Don't miss the next options analysis on the SPXwhere I detail these key benchmarks and how it is shaping the institutional map of the market.
Stay tuned, that's where it's understood. how market movement actually evolves.
Macro impact and intermarket contagion
The effect of the new tariffs was not limited to equities. Trump's move came at a particularly sensitive time: with the U.S. government partially closedwhere I have already pointed out and analyzed, federal layoffs and a market saturated with leverage and optimistic expectations.
The chain reaction went hand in hand with the Treasury bond yields fell hard because of the search for shelter, while the corporate credit spreadsboth investment grade (IG) and high yield (HY), widened at their fastest pace since April. This reflects that the nervousness spread beyond equities, affecting also the private credit marketone of the most sensitive to liquidity risk.
The precious metals confirmed the defensive turn, the gold surpassed for the first time the 4,000 dollarsThe silver showed a strong backwardation (the spot price higher than the futures price), which is a sign of physical stress in the supply and a real increase in the demand for coverage.
At the same time, the US dollar rebounded on the back of a weaker yen, and the cryptocurrencies suffered their worst week since Junereflecting a clear pattern of "risk-off"As a result, investors abandoned speculative assets and sought safety in debt and metals.
Everything that has happened confirms that volatility is no longer confined to the stock market. It has spread to bonds, credit and commodities, showing the first signs of a intermarket contagion. When volatility begins to move in unison across multiple assets, what was once a technical correction can turn into a phase of systemic risk restructuring.
Upcoming weeks: OPEX and earnings season
In the coming weeks, the combination of the expiration of options (OPEX) and the start of the corporate results season could add an extra layer of volatility to a market already showing clear signs of fragility.
If the automatic sales flows continue and the demand for volatility hedges continues to increase, we could be looking at a structural transition of the volatility regimeThis has not been seen since 2020.
In an environment of "compressed volatility" (vol crushed)prices move in an orderly fashion because investors and dealers hold long positions in gamma, which dampens movements.
But when the system changes to a regime of "expansive volatility"If this balance is broken, hedging increases, liquidity is reduced and price movements are amplified both upward and downward.
This type of transition usually generates more sensitivity to macro data and headlinesEach event, speech or publication can trigger much more pronounced oscillations.
In other words, volatility ceases to be a reflection of fear and becomes its driving force.amplifying each movement.


