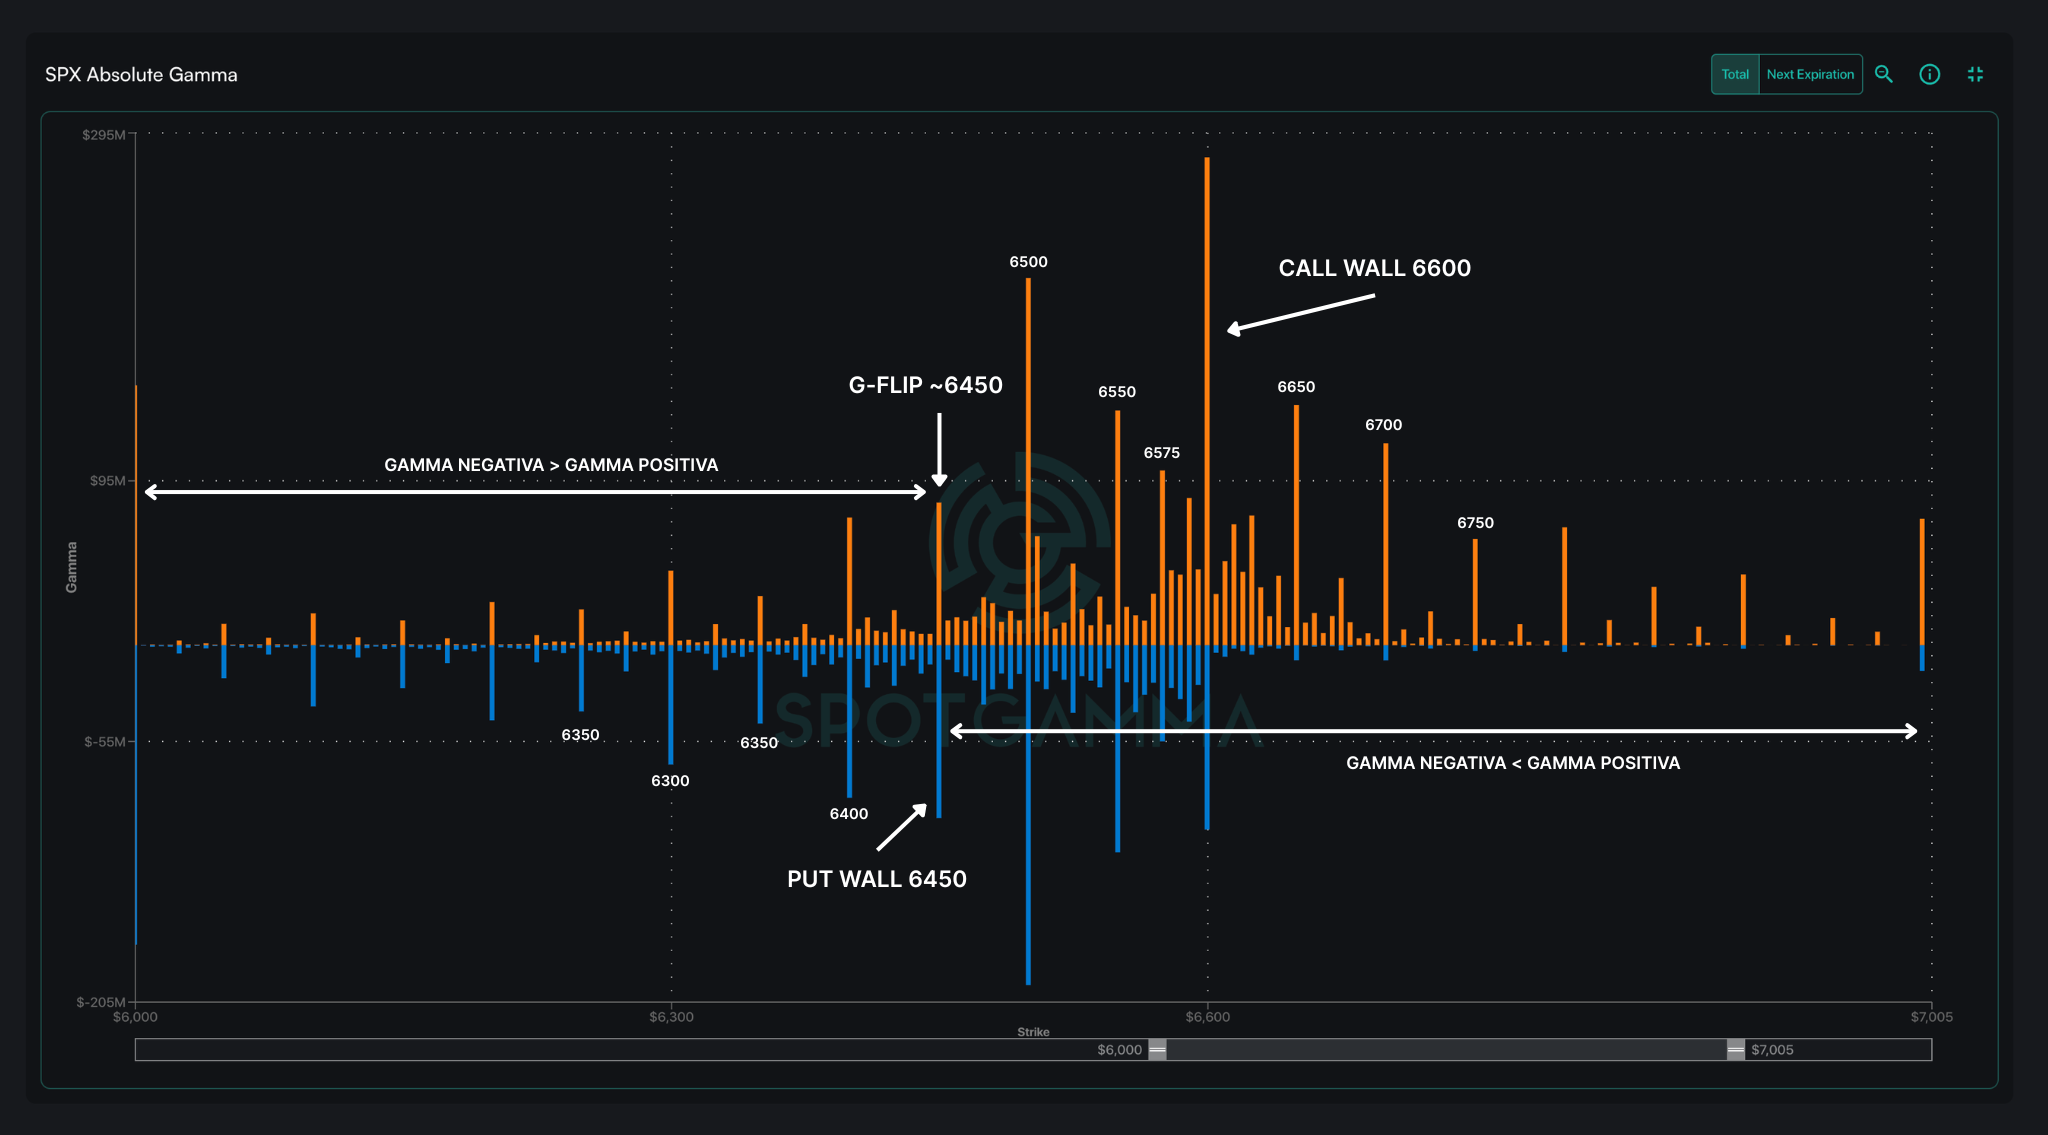
I am Diego García del Río and in this analysis I would like to highlight how the positioning in options of the SPX reflects a market caught between strong support and resistance zones. The gamma is concentrated around the range of 6450 - 6600 points where the Put Wall and the Call Wall generate countervailing forces that constrain price action. As I point out, Diego García del Río The environment becomes particularly sensitive this week, marked by several key catalysts.
The September 17 two catalysts come together: the VIX expiration in the morning and Fed meeting (FOMC) in the afternoon. VIX Expiration, in an environment of historically low implied volatility, can generate vol cover if there is a sharp move, amplifying volatility. The FOMC is the central event: a dovish message would reinforce the bullish bias toward 6600 while a more restrictive tone could reactivate declines towards the low end of the range. 6400-6300.
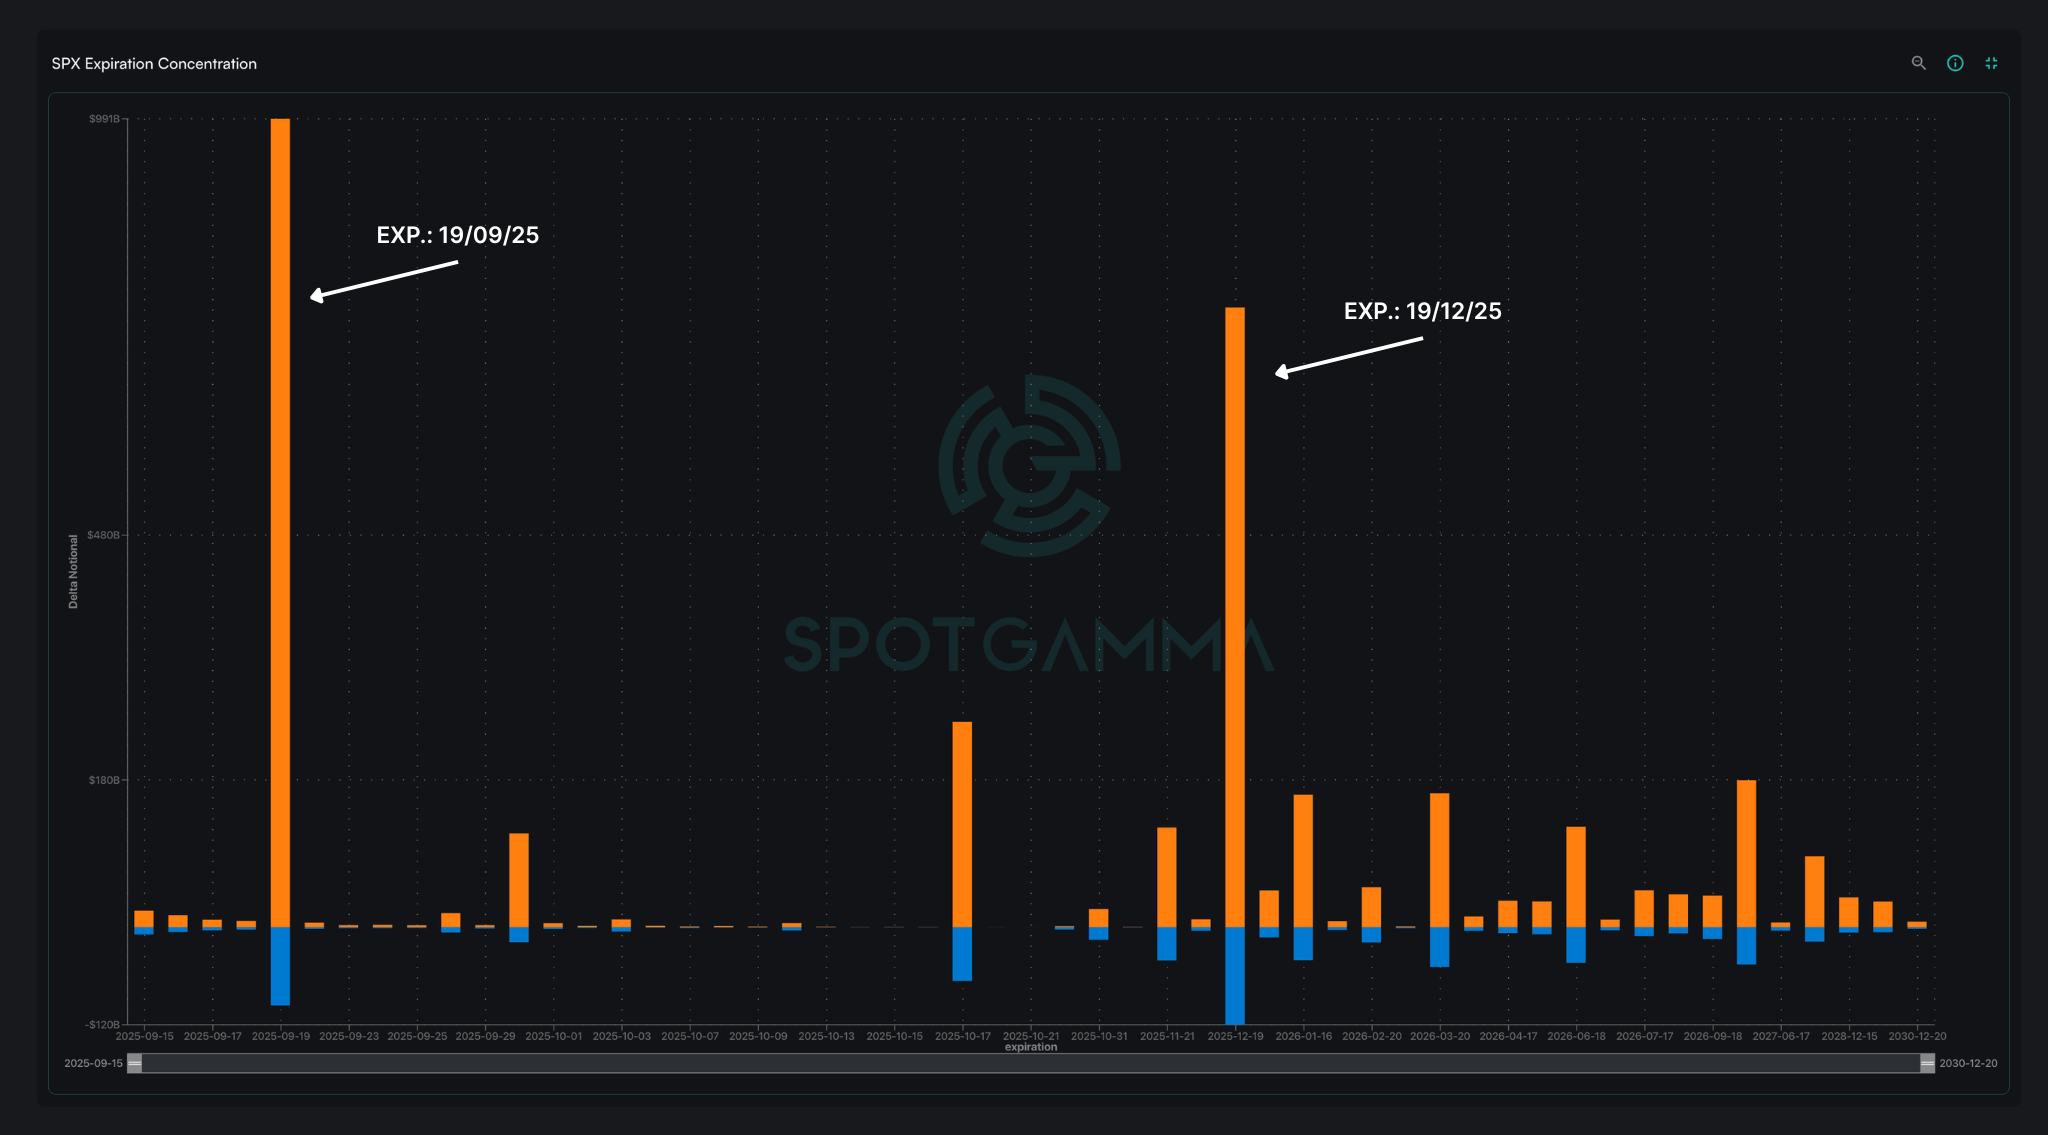
The September 19 arrives on Quarterly OPEX The largest accumulation of contracts for the month, as shown in the chart in Expiration Concentration. In my analysis, I, Diego García del Río I note that this expiration not only involves heavy volume in the SPX, but also in Nasdaq (NQ) futures, which multiplies the impact on index dynamics. In practice, this gamma concentration usually keeps the market "pinned" around levels of heightened institutional interest until Friday. Once settled, dealers release exposure, which increases the likelihood of more directional moves the following week.
In terms of importance, the FOMC remains the most decisive event, as it sets the macro and monetary tone. The Quarterly OPEX is in second place in terms of the magnitude of the repositioning it generates, followed by the VIX expiration which adds a technical component of tactical volatility.
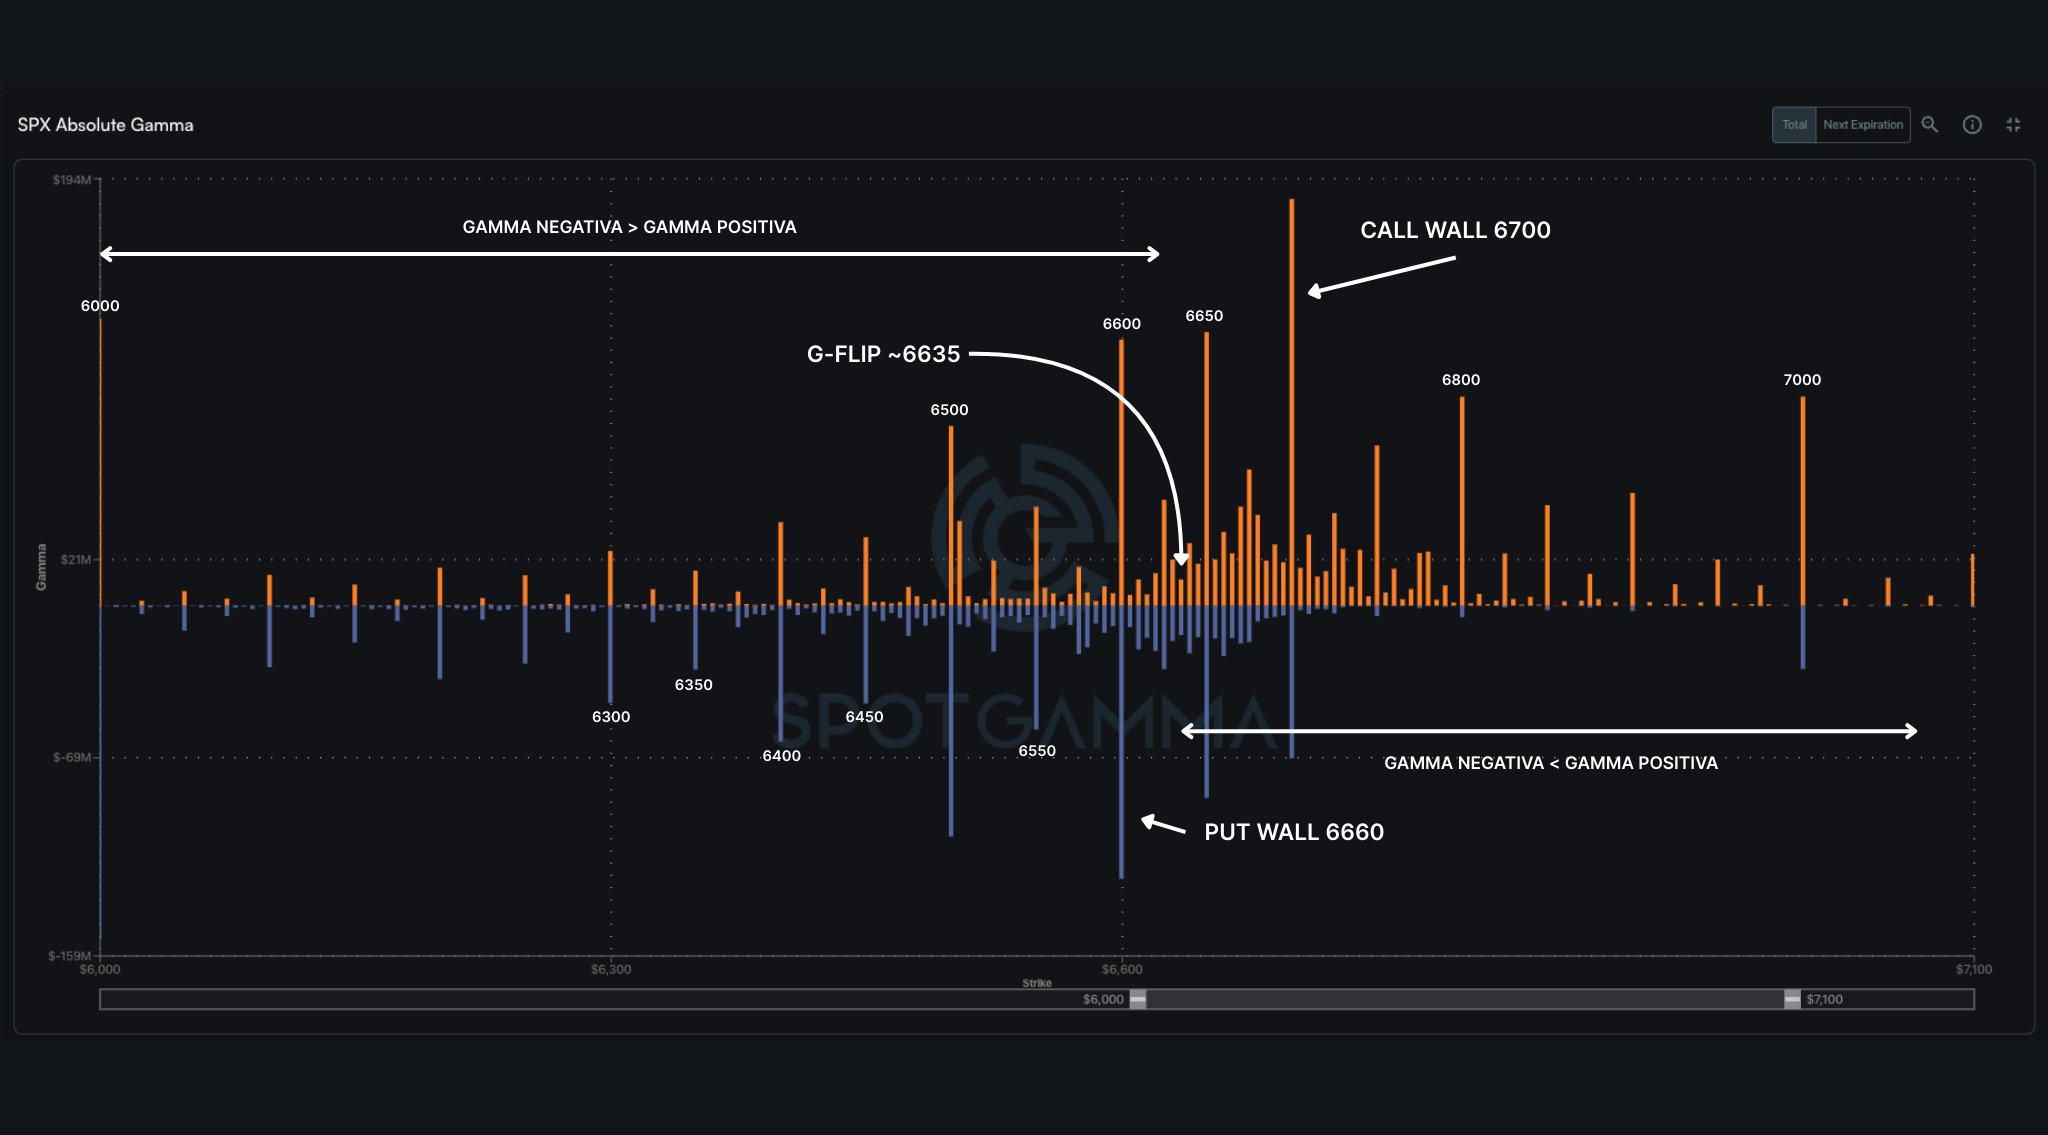
G-FLIP AT 6450: GAMMA TIPPING POINT
The G-FLIP (~6450) marks the transition between negative gamma y positive gamma.
Below 6450: dealers are forced to sell on dips and buy on rises, amplifying volatility.
Above 6450: the market enters a more stable phase, where hedging tends to reduce the risk of abrupt movements.
PUT WALL AT 6450: CRITICAL SPX SUPPORT
The Put Wall at 6450 represents the main institutional support. The high concentration of open puts at this strike forces dealers to defend it by hedging. A clear break below would open the door to falls towards the lows. 6300 - 6000 points significantly increasing volatility.
CALL WALL AT 6600: DOMINANT TECHNICAL RESISTANCE
On the upper side, the Call Wall at 6600 acts as the SPX's most relevant resistance. This concentration of calls limits the upward trajectory, as it generates selling pressure when the index approaches this level. In between, the strikes of 6500 y 6550 also function as intermediate resistors that reinforce the containment strip.
SHORT-TERM TECHNICAL OUTLOOK FOR THE SPX
The current gamma structure suggests a consolidation range between 6450 and 6600 points. As long as the index remains above the Put Wall dynamics favors stability. However, a rupture under the G-FLIP would expose the SPX to more volatile moves towards 6300-6000. In my analysis, I, Diego García del Río I note that in the opposite scenario, a sustained break above the 6600 barrier would require an external catalyst to boost buying appetite.
KEY SUPPORT AND RESISTANCE LEVELS IN SPX (09-15)
The first critical support is at 6450 where the accumulation of puts reinforces the institutional defense. A breakout would open the way for falls towards 6400 (key pivot) and subsequently to the 6300 - 6000 points This is a major psychological support zone.
On the upper side, the first ceiling is at 6500 This level also coincides with SpotGamma's strategic pivot:
SPX > 6500: Bullish bias, with a probability of testing 6600 points before the FOMC.
SPX < 6500: Bias change to risk-off with a higher probability of correction towards the 64xx zone.
The strongest resistance remains in the 6600 points (Call Wall) which acts as an institutional ceiling. This level can act as a price magnet until Wednesday 17, but also as an anchor to stop any breakout attempt.
| SUPPORTS | RESISTANCE |
| 6660 | 6600 |
| 6500 | 6625 |
| 6400 | – |
SPX STRATEGIC PERSPECTIVE
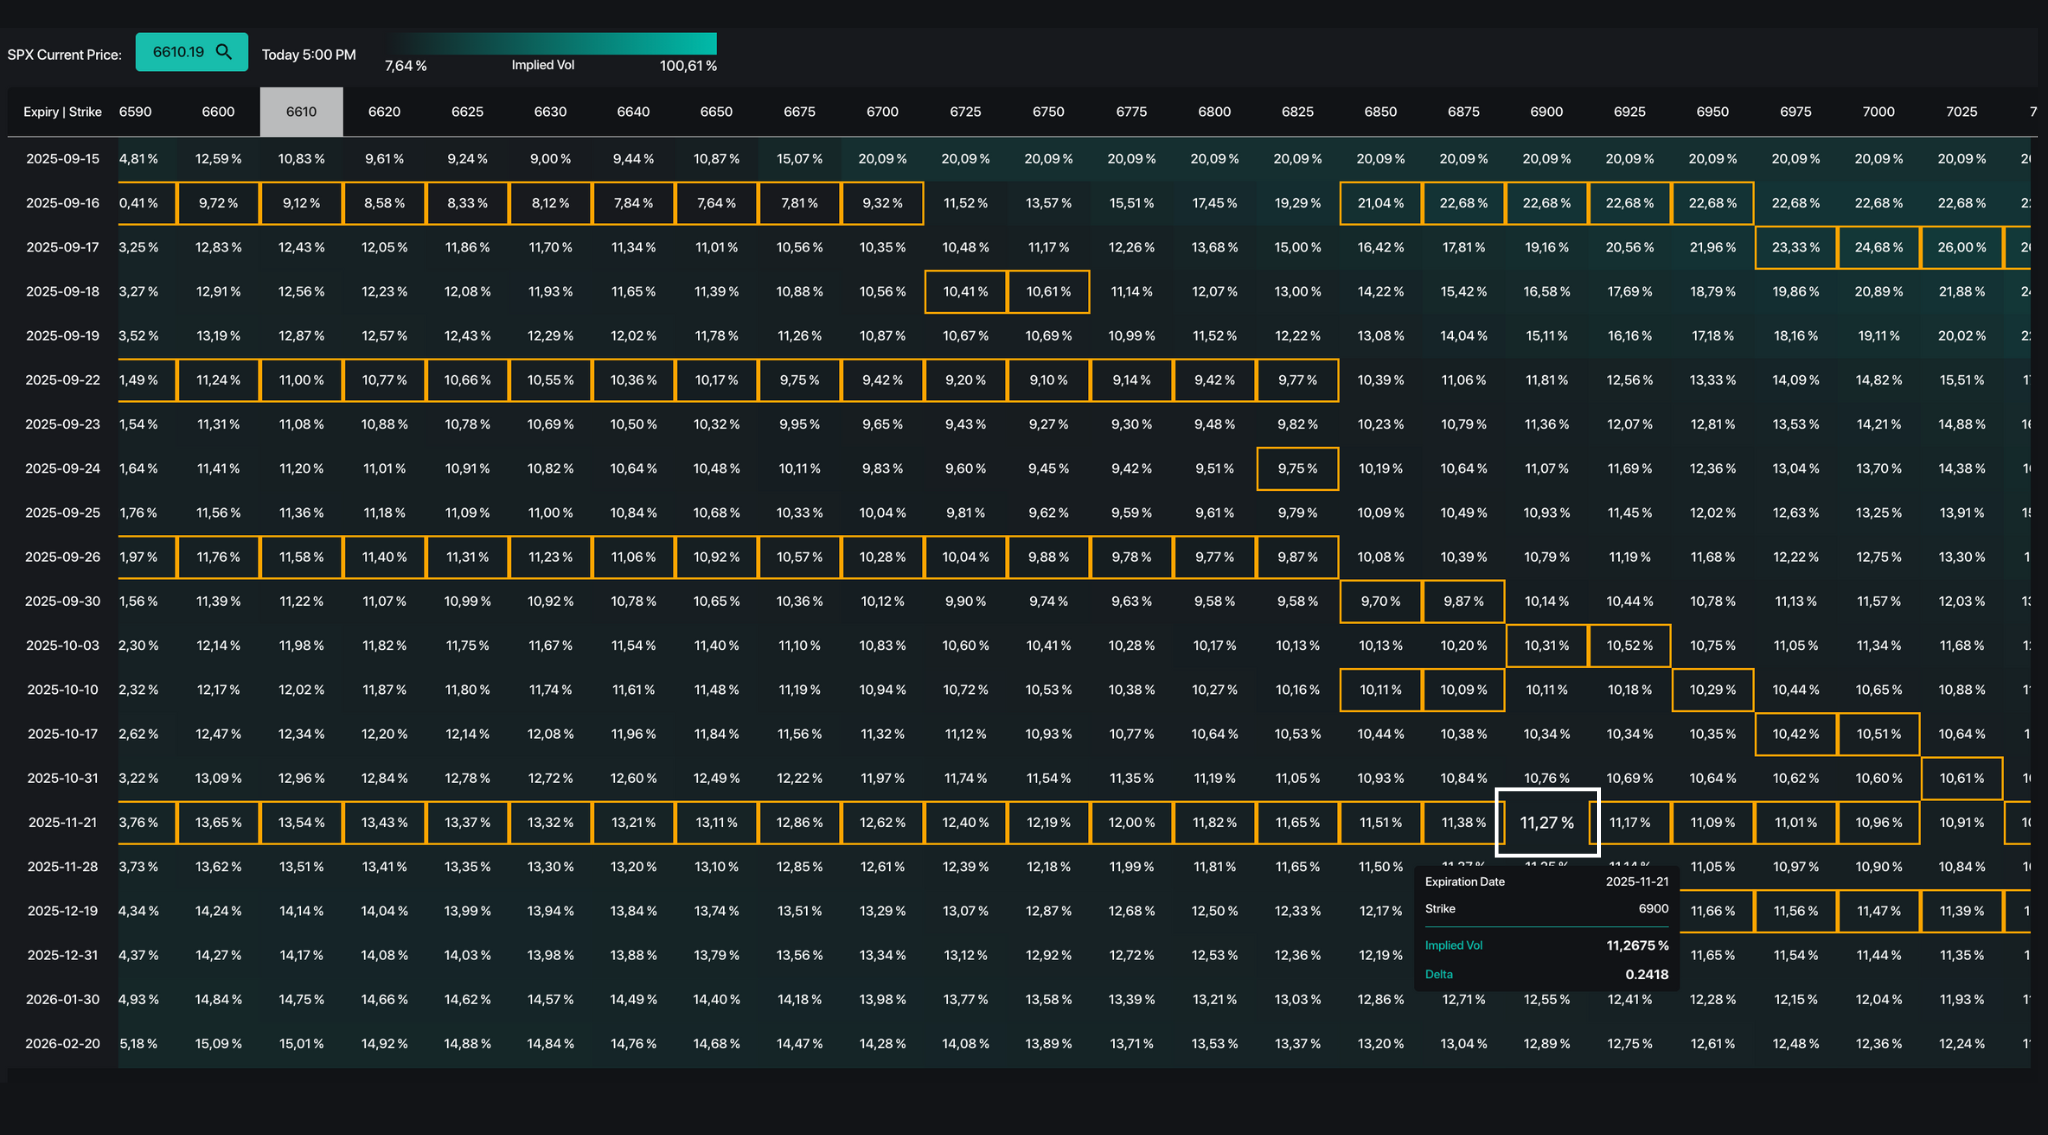
The market is in "risk-on while SPX >6500".. However, the proximity of the VIX Expiration and the FOMC increases the risk that any sharp movement in volatility will trigger aggressive hedging. In my view as a Diego García del Río the current complacency is reflected in some of the IV's at historic lows (~5%) This creates a dangerous situation: an unexpected movement could provoke a "vol cover" with violent jumps in prices.
In this environment, many managers favor mixed tactics:
- Upside controlled: Cheap calls, on Oct-Nov at 25 delta, covering fall rally, at 11-12% IV, positions at +4-6% OTM, to capture a potential rally towards 6600.
- Tactical protection: Cheap Puts and type structures put flies in 63xx strikes, to cover a correction scenario after the OPEX.
The factor TSLA adds an additional nuance. The purchase of +2 million shares by Elon Musk (~1,000M USD) boosted the stock by +7% in premarket, reinforcing positive sentiment in the tech sector. This could act as a partial catalyst for the SPX to test resistance, although macro validation on Wednesday is still pending.
