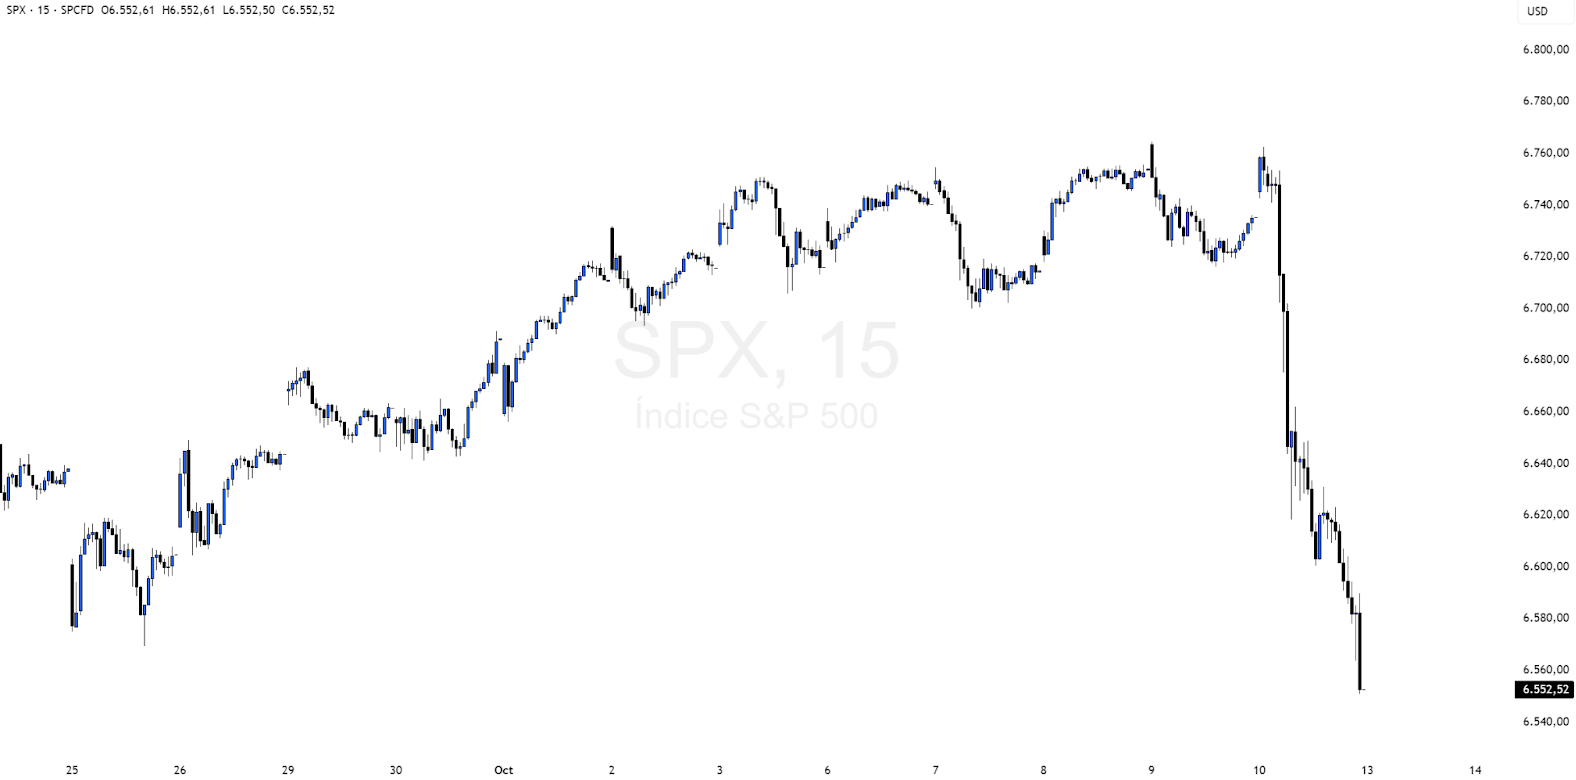
With the risks associated with end-of-quarter rebalancing already completedincluding VIX maturitiesthe triple witching hour (expiration of three types of derivative contracts, options on individual stocks, futures and options on stock indexes) and the JPMorgan necklace rollthe SPX maintains firm upward trajectoryIt is quite likely that it will continue to point to new highs towards the end of the year.
Mainly, the 7000 point zone acts as natural magnet for DecemberThe market currently retains the short leg of the JPM necklace. Currently, the market retains positive gamma above 6630 pointsThe price of the commodities below this level could accelerate.
Referring to "natural magnet for December", keep in mind that it is a large quantity of open interest contracts directly influencing the performance of the index. When this level coincides with a strong gamma exposure or with a strike key to a systemic fund (such as the JPMorgan necklace), the market tends to to look for it progressively as the expiration date approachesespecially if the volatility remains contained. Therefore, these levels act like "magnets", the price tends to converge towards them before maturity.
There is a excessive long exposure y extreme positions in volatility control funds and CTAs, which implies that, if the market enters volatility control negative gammaAny correction could quickly intensify. A rebound in volatility would also force hedging purchasesamplifying the downward movement. The market is quiet, but investors are paying high premiums for protectionThis can be clearly seen in the behavior of VIX and SPX, both indexes have a negative correlation, which means that when one rises, the other systematically falls, in the last few days this behavior is changing, both indexes are rising in parallel.
According to Goldman SachsThis reinforces what has been said in the last few weeks, the market is showing a constant search for protectionas if the chaos was just around the corner. However, unless that scenario actually materializes, these hedges will prove to be an extremely expensive gamble.
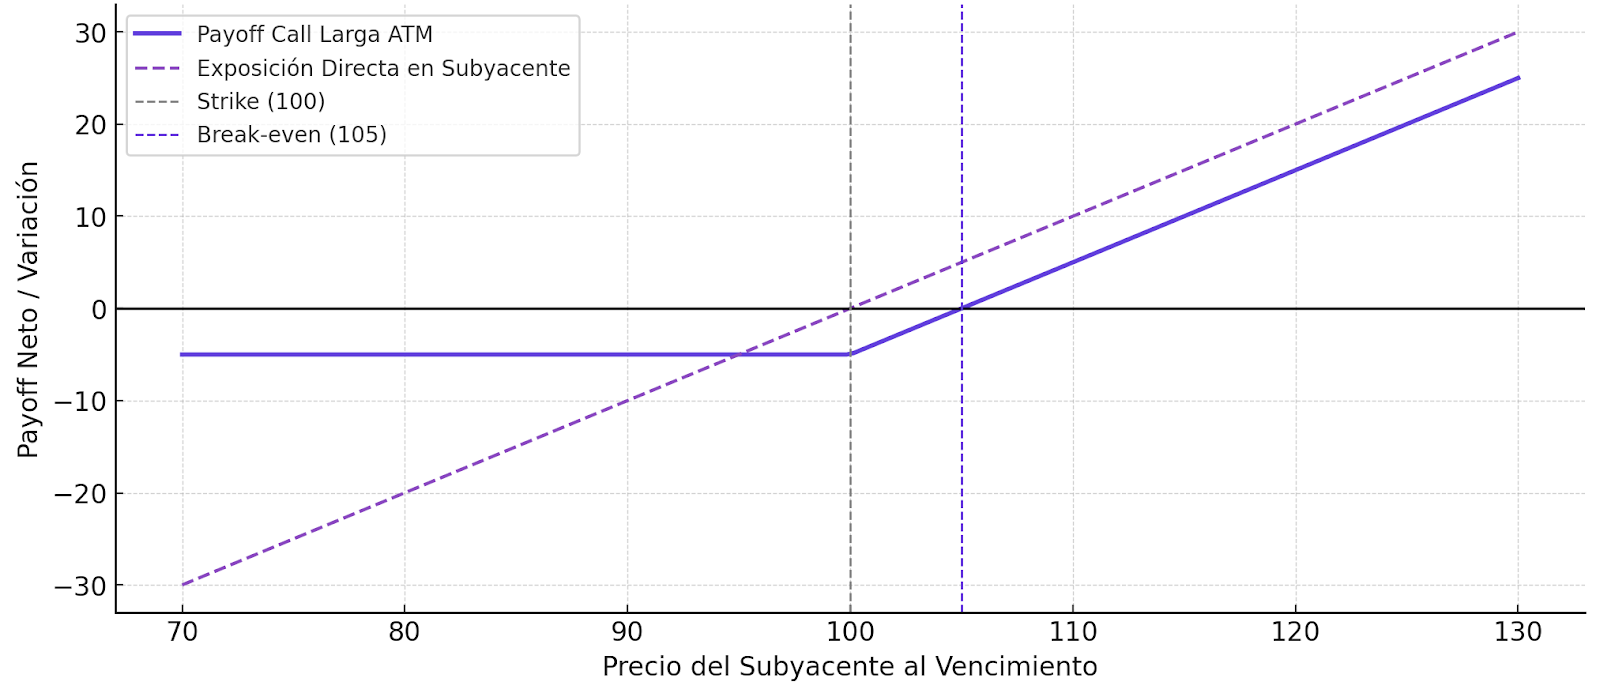
In itself, options are expensive, so that, mathematicallymakes more sense sell options, create ratio differentials over $VIX o sell short-term volatility This tells me that the market is in a very difficult situation. state of preventive paranoiaeveryone expects a shock, but as long as it doesn't happen, volatility sellers are the ones capturing the profitability of fear.
Gamma and Institutional Positioning
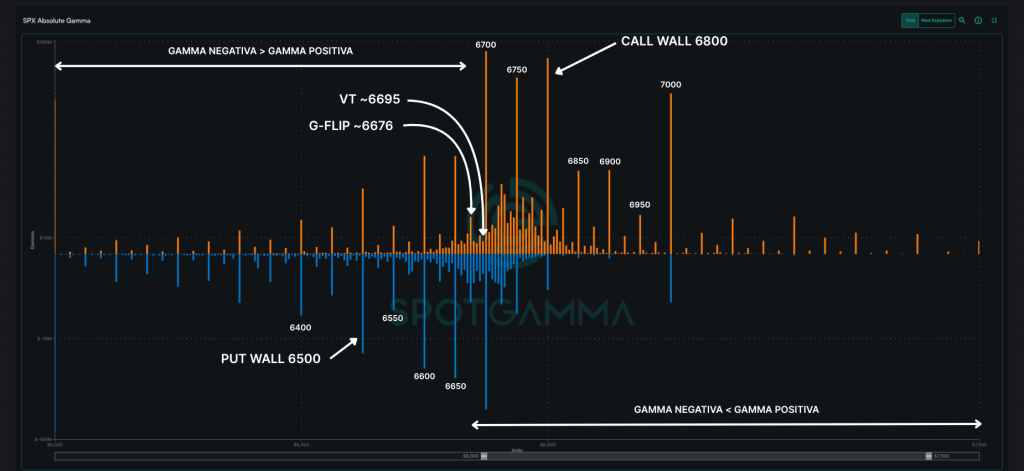
Regarding the gamma structurea significant strong concentration of positive gamma above 6635 pointswhich reinforces the market stability as long as the index remains in that range. Below that level, the dynamics of the becomes destabilizingsince the dealers are forced to sell on dips and buy on risesamplifying price movements.
- Call Wall (6800): Institutional ceiling that acts as a price magnetbut also as a breakthrough barrier before any bullish extension attempt.
- Put Wall (6500): Critical zone of immediate supportwhere the further accumulation of puts and, therefore, the most relevant defense in the market.
- G-FLIP (6676): Regime change point between stabilization (positive gamma) and increasing volatility (negative gamma).
The proximity of JPMorgan's big strike at 6955 for the December 31 maturity adds a downward pressure component in the event that the index loses 6,500 points, since the dealers would tend to synchronize coverage and gamma exposure with that level, increasing the risk of downward acceleration.
Volatility Complex
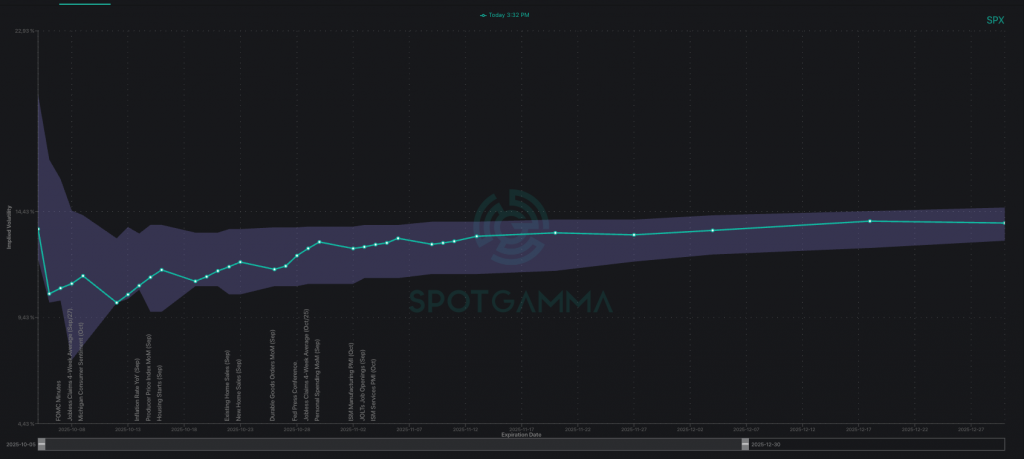
As mentioned above, the divergence between SPX implied volatility (~10%) and VIX (15-16) continues to be one of the most relevant structural imbalances in the market.
The selling pressure on short volatility (≤5 DTE) maintains premiums depressedbut increases the sensitivity of the system unexpected events that require a change in the forced repurchase of volatility (vol cover).
The VIX time structure clearly reflects this dynamic, the curve maintains a pronounced contango (the future price is higher than the current price). This indicates that traders are financing its long positions in structural volatility by means of the recurring sale of short-term options on the SPX.
The result is a unusually steep volatility curve which acts as a compressed springif it begins to flattenthe adjustment could manifest itself in a rapid rebound of short-term IVs or in a downward convergence of the VIX itselfTaking into account the item entryThis environment suggests that the apparent calm in the market is more fragile than it seems. A single catalyst, macroeconomic, geopolitical or institutional flows, would be enough to breaking the current equilibrium and generate a sudden transition to a higher volatility regime.
SPX KEY SUPPORT AND RESISTANCE (10-06)
The SPX consolidates on the pivot at 6680 pointsA drop at this point would mark a test of the 6600 support. From the above, with a bullish rise, the market would face how next barriers to test, 6750 y 6765with a more robust ceiling at 6800 (Call Wall).
The roll of JPM's institutional collar, located at the short leg at 6955, acts as a bullish magnet, where this point also becomes a barrier to beat at the end of the year.
| SUPPORTS | RESISTANCE |
| 6700 | 6750 |
| 6680 | 6765 |
| 6600 | – |
Economic Calendar
The most relevant events in the U.S. market for this week are as follows:
08/10: IEA crude oil inventories and Fed meeting minutes.
09/10: Statements by Fed Chairman Powell and new jobless claims.
10/10: September monthly average hourly earnings, September nonfarm payrolls and September unemployment rate.
Remember that we are still in shutdownwith expectations of a duration of more than three weeks.
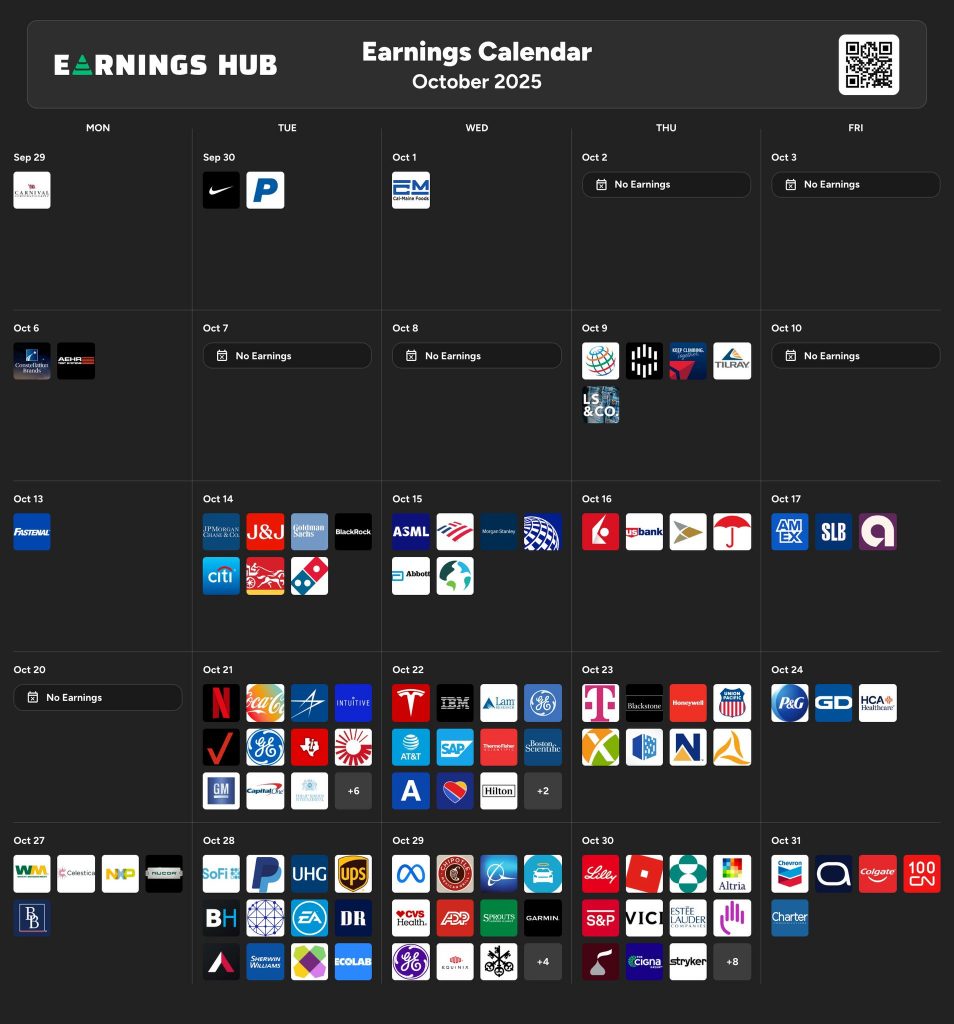
Results Calendar
As an extra of the month, we start with the results of companies, which will be key, being catalysts to determine the next rally.
