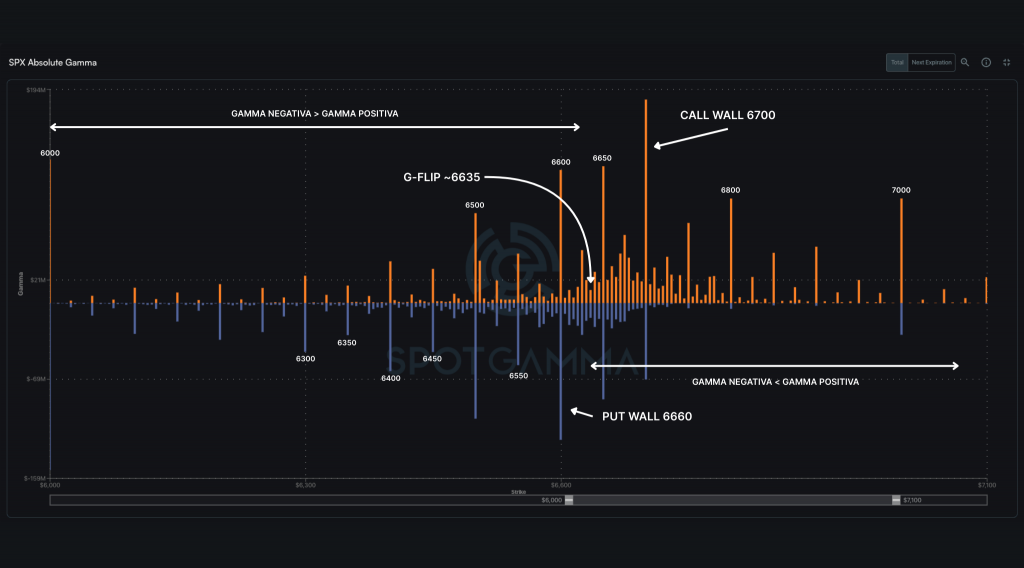
I am Diego García del Río y en este análisis explico cómo el SPX arranca la semana en consolidación tras marcar máximos históricos el viernes. Los futuros abrieron con un retroceso moderado (~30bps), en un entorno donde el 6,600 pivot remains the central reference. The range remains well defined between Put Wall at 6,660 and the Call Wall at 6,700 with a G-FLIP around 6.635 which marks the inflection point between negative and positive gamma.
Gamma and institutional positioning in SPX
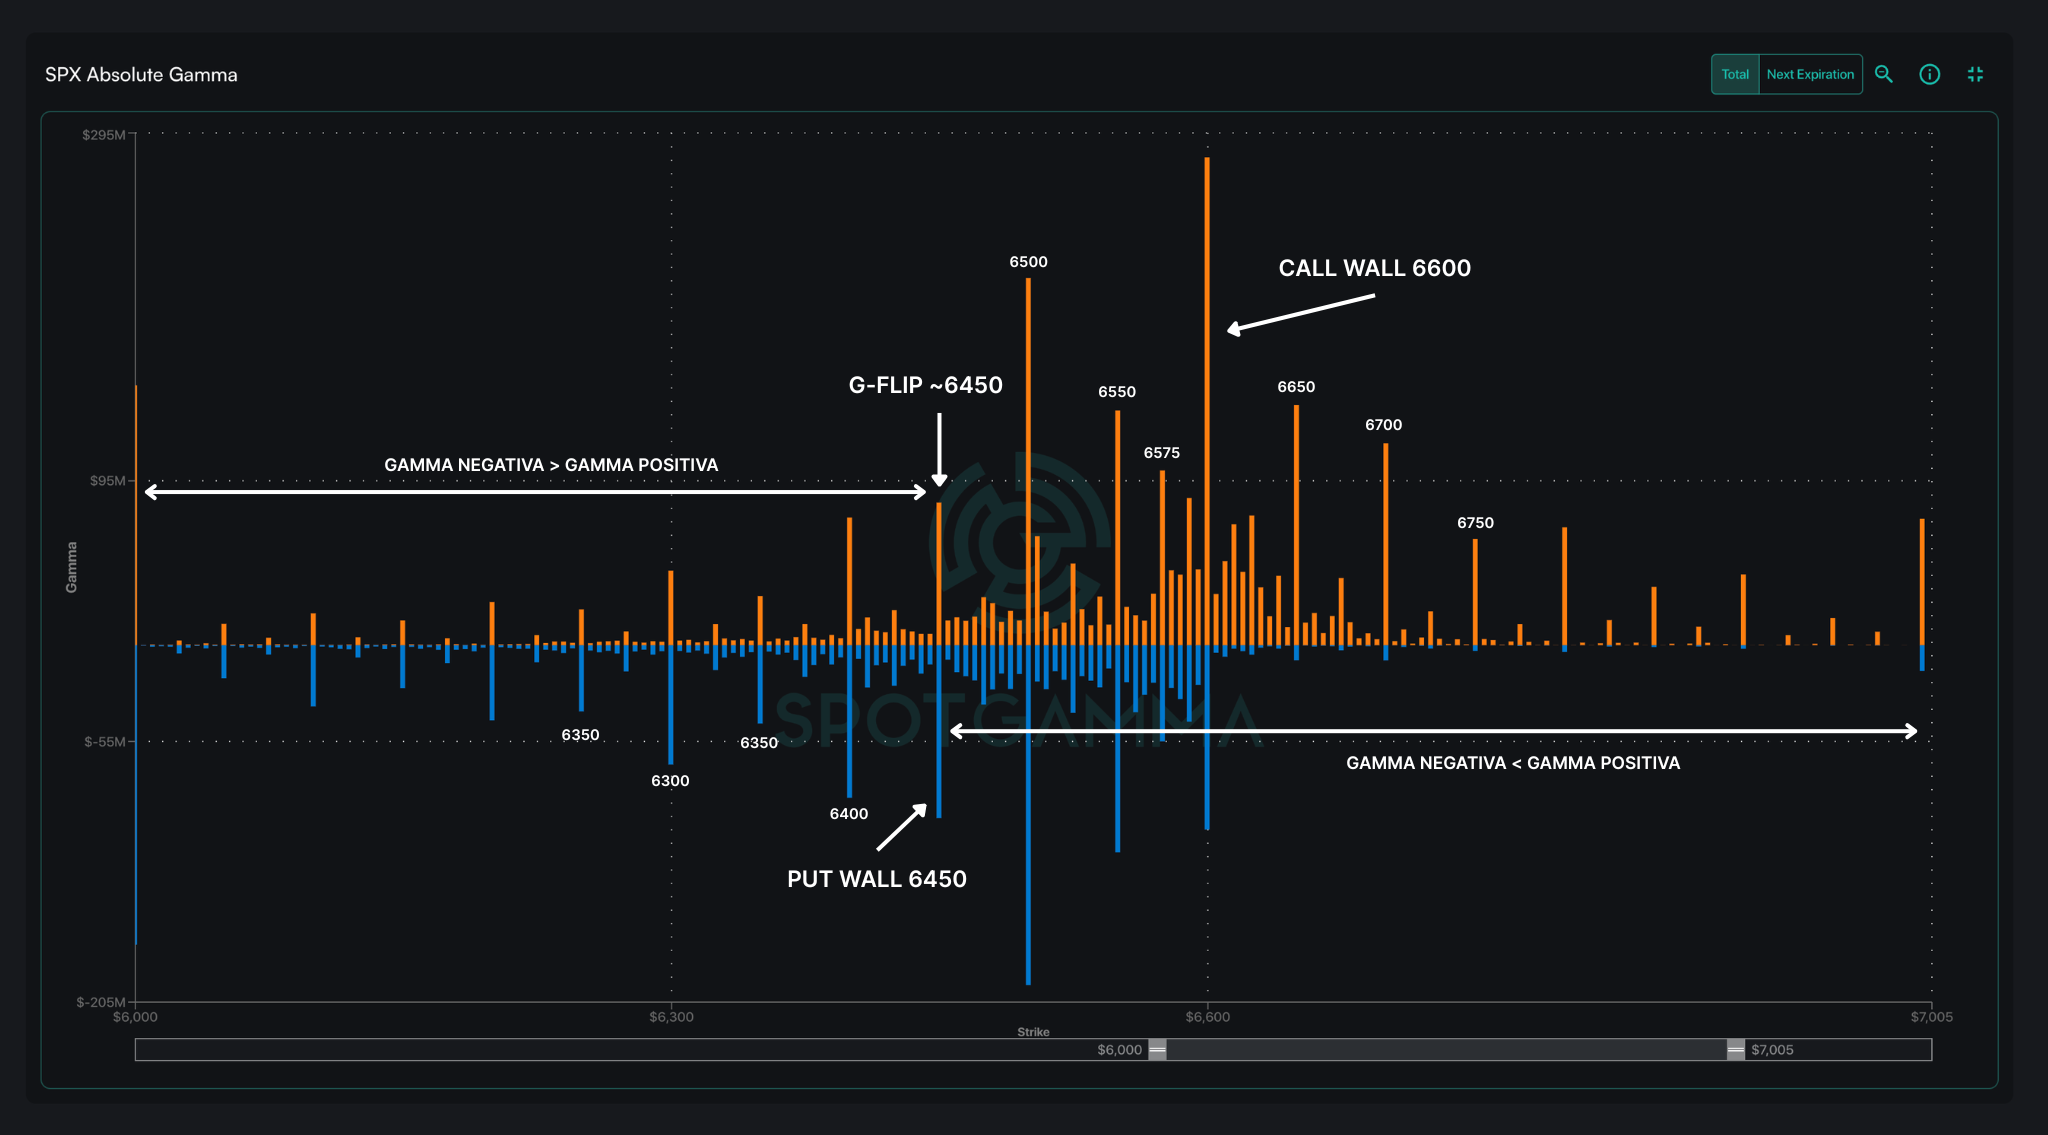
The chart below shows a strong concentration of positive gamma above 6635, reinforcing stability as long as the index remains in that range. Below that level, the dynamics become more destabilizing, with dealers forced to sell on dips and buy on rallies, amplifying the moves.
Call Wall (6700): Institutional ceiling that acts as a price magnet, but also as a breakthrough barrier.
Put Wall (6660): Critical zone of immediate support, where the greatest accumulation of puts is concentrated.
G-FLIP (6635): Regime shift between stabilization and increasing volatility.
The proximity of JPM's major strike at 6505 for expiration on 30/09 adds downward pressure if 6600 is lost, as dealers would tend to synchronize positions with that level.
Upcoming catalysts and weekly calendar
23/09: Manufacturing and services PMI (Sep), remarks by Powell.
24/09: New home sales and IEA crude oil inventory update.
25/09: GDP (Quarterly), new claims for unemployment benefits and second-hand home sales for August.
26/09: Underlying monthly and annual personal consumption expenditure prices.
The market structure favors bullish continuation as long as the SPX >6600, but the +2% rally in the last 2 weeks leaves room for a tactical cooldown.
VIX Volatility Complex
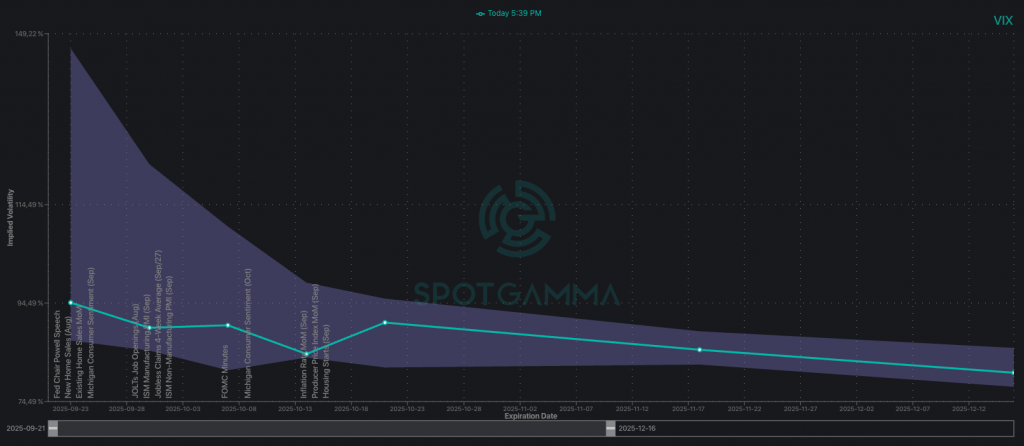
En mi visión como Diego García del Río , la dislocación entre la SPX IV (~10%) and the VIX (15-16) remains one of the most relevant factors. The massive short volatility sell-off (≤5 DTE) keeps premiums at minimums, but exposes the market to "vol cover" episodes if an unexpected shock occurs.
The term structure of the VIX reflects this imbalance, the curve is at very pronounced contango with long maturities trading at a considerable premium to the spot VIX. This suggests that investors holding long positions in volatility futures are offsetting that cost through systematic short-selling of volatility in the SPX. The result is an extremely steep curve that, if it begins to flatten, could lead to an upward adjustment in short-term IVs or a downward normalization of the VIX itself.
In strategic terms, this configuration implies that the apparent current stability is more vulnerable than is reflected in the index. In the case of the SPX, all it takes is a catalytic macro, geopolitical or flow event to trigger a regime change in volatility and break the equilibrium that has kept the SPX in risk-on.
KEY SPX SUPPORT AND RESISTANCE
The SPX consolidates above the 6600 pivot point level that divides the balance between bullish control and greater vulnerability. On the upside, the market is facing obstacles in 6650 y 6675 with a more robust ceiling at 6700 (Call Wall) that could put the brakes on any attempt to extend the rally.
In the lower part, the immediate support remains 6600 The rupture of which would reactivate the pressure on the 6500-6505 This level is dominated by JPM's institutional exposure at month-end expiration. This strike has become the tactical anchor for dealers, configuring the zone of greatest bearish defense in the short term.
| SUPPORTS | RESISTANCE |
| 6600 | 6700 |
| 6500 | 6675 |
| - | 6650 |
SPX STRATEGIC PERSPECTIVE
The market remains at risk-on mode as long as the SPX trades above 6600 points. supported by the concentration of positive gamma between 6600-6700. This positioning stabilizes the price action and keeps the bullish bias alive. However, recent post-rally overbought conditions are forcing managers to diversify tactics going forward. expiration on 30/09 when a high volume of exposure is released.
The prevailing strategies reflect this balance:
- Tactical coverage through put spreads and put flies around 6500-6505.
- Moderate Upside with OTM calls towards 6700-6750, although the skew makes this bet more expensive.
- Short-term Hedges with 1 week to 1 month puts, taking advantage of depressed implied volatility.
En resumen, mi conclusión como Diego García del Río es que los alcistas dominan mientras se conserve 6600, pero el end-of-month repositioning could act as a catalyst for regime change and give way to greater directional instability.
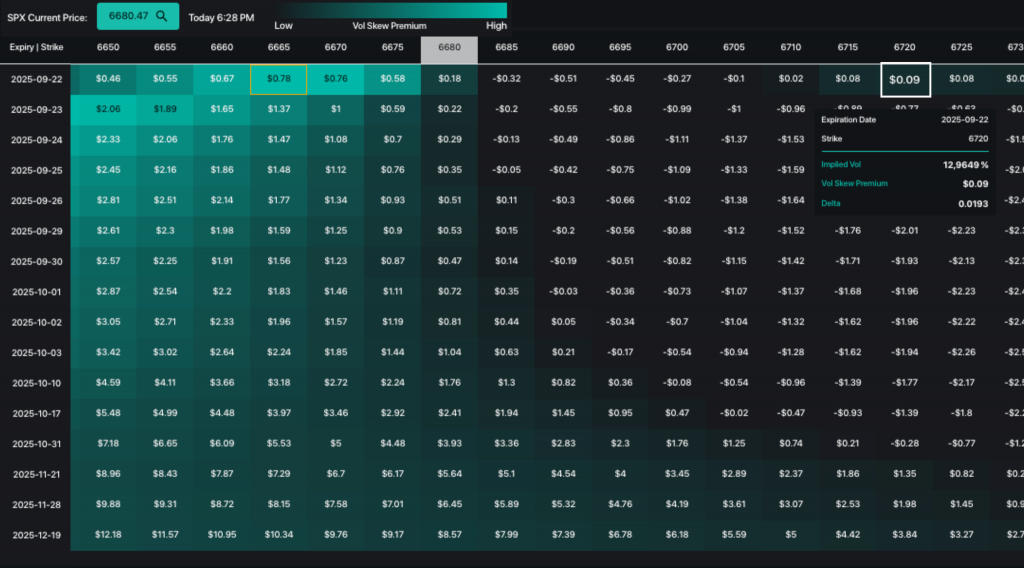
With the prospect of a moderate upside the strike 6720 is emerging as an optimal level within the resistance range (6700-6750). At these strikes, the contract offers a delta around 0.25-0.30 which provides favorable convexity and a reduced cost versus spot, at a premium close to 0.10 (to be exact 0.09 although it should be noted that it may have fluctuated since the publication of this). This strike allows positioning with limited risk and an attractive risk/reward ratio in the event of an extension towards the top of the range.
